Center of expertise on nonlinear thermodynamic complex-systemic macro-analysis of human and natural domains

Our current working-thesis, from a technical point of view

Our current working-thesis, in a nutshell, is, roughly and technically formulated, that:
- a complex-dynamic system with a transactional infrastructure and heterogeneous agents, that tends towards an optimal entropy-production rate, will always show a pareto-distribution in transactional concentration;
- an increase in complexity of this infrastructure will increase the skewness of this distribution (a higher index of transactional concentration1)
All of our socio-economic, financial and technological systems, and biological ecosystems, belong to this class of systems. Obviously, the 'increase in complexity' is currently relatively large in our financial and technological systems.
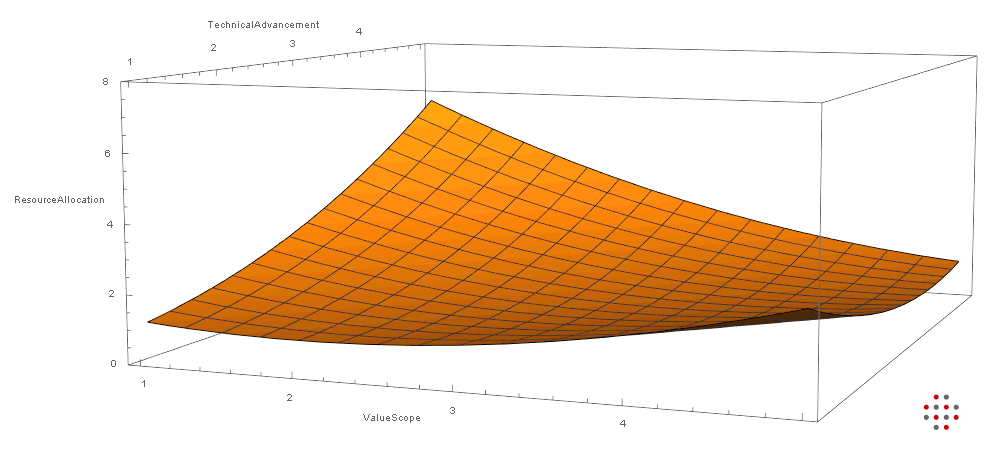
To translate this to our current era, for example, it illustrates peak-technology very well. An increase in technological progress (complexity) will increase the concentration of (intellectual and capital) resources, and will decrease the scope of added (systemic) value.
E.g. simple medical technology adds high value to many, but CRISPR takes up huge resources while adding little value to few.
In the graph below, which is purely illustrative, one can pinpoint peak-technology at a level of TechnicalAdvancement (complexity) somewhere near 2.5: it draws resource-allocation (transactional concentration) towards a smaller 'scope of value' within the domain, instead of a larger scope.

This means that, as long as technological progress continues after that inflection point, this type of systemic degradation will continue as well.
Obviously, it is imperative to understand this technical principle, and develop an empirical methodology for it, if we want to succeed in constructing a new, 'inclusive' economic framework, to distribute value in a much wider scope again.
Practically, this means identifying (per domain) the infrastructure and agents that are driven by this dynamic (often at a high abstraction level), and then trying to model the behavior and assess the nonlinear-dynamic aspects (attractors, bifurcations, etc).
In ideal cases, this should yield some rough (multidimensional) stability landscape, in which the current location of the systemic state, and its trend, can be pinpointed, and monitored.
This effectively translates a highly intricate complex system to a visual representation, in which even 'thresholds' of 'desired areas' for the systemic state, can be added.
It will not yield a 'predictive' paradigm of any kind, but it will surely help to understand the dynamics that drive our habitats, by:
- empirically assessing a 'typology' of dynamic aspects that occur,
- developing a general taxonomy for it, by using the conceptual framework and numbercrunching
We are currently developing a software-suite for modeling, metrics and visualization, of these nonlinearly dissipative systems, to test our hypothesis. We will elaborate on this in future blogs.
1) 'Concentration index of a network-topology', ranging from 0 to 1, where 0 indicates even distribution of betweenness centrality, and 1 indicates a topology with a single hub with maximum centrality.

